In this scenario the end users where experiencing intermittent slow performance of their application. It would occur at random intervals during the working day at no specific times.
Most of the symptoms were timeouts or a slow loading time for specific reports.
The first check was to make sure the cached execution plans looked ok for the specific query.
Select
DB_NAME(st.dbid) DBName
,OBJECT_SCHEMA_NAME(st.objectid,st.dbid) SchemaName
,OBJECT_NAME(st.objectid,st.dbid) StoredProcedure
,max(cp.usecounts) Execution_count
,st.text
,cp.plan_handle
,CONVERT( XML, CAST(qp.query_plan AS VARCHAR(MAX)) )
FROM sys.dm_exec_cached_plans cp
CROSS APPLY sys.dm_exec_sql_text(cp.plan_handle) st
CROSS APPLY sys.dm_exec_query_plan(cp.plan_handle) qp
where DB_NAME(st.dbid) = 'MyDatabaseNameHere'
and cp.objtype = 'Adhoc'
and st.text LIKE '% ''%'
Group by
cp.plan_handle,
st.text,
DB_NAME(st.dbid),
OBJECT_SCHEMA_NAME(st.objectid,st.dbid),
OBJECT_NAME(st.objectid,st.dbid)
, CAST (qp.query_plan AS VARCHAR(MAX))
order by max(cp.usecounts) desc
A
look at the cached execution showed a RID Lookup with 90 %Cost to the
query. This was reviewed and a covering index was created to overcome
the RID Lookup shown in Figure 1.

Figure 1
The execution plan now improved, looked like this with an Index Seek as shown in Figure 2.
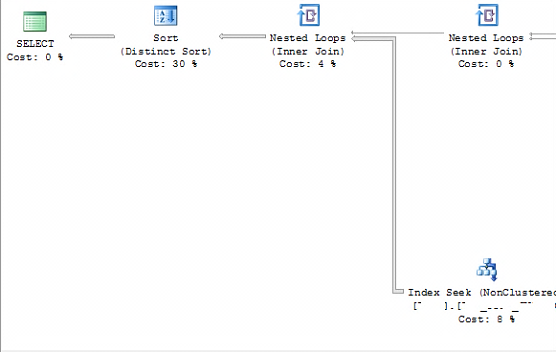
Figure 2
It
was anticipated this improvement in the execution plan would help
performance but users where still complaining of slow performance at
intervals during the working day. This was something that was not easily
replicated as each time the application was tested by the support team
performance was good including during peak times.
A
further revisit of the cached execution plan was done. Later in the day
an unexpected observation was noted on the query execution count. Early
on in the day the execution count of the query was around 50. When
looked at again in the afternoon it had decreased in count to 1.
At
first glance this did not make sense as to how an execution count could
have decreased. This required a look at the stats of the query using
the DMV dm_exec_query_stats. Using the plan_handle of the execution plan we could pull up more information about its stats.
SELECT * FROM sys.dm_exec_query_stats S
CROSS APPLY sys.dm_exec_sql_text (S.sql_handle)
WHERE plan_handle= 0x060005002F20A31FE0043F1…………...………
Below
you can see the creation time for the plan was in the afternoon with an
execution count of 1. This now shed light on why users were experencing
intermittent slow performance because the execuction plan was being
flushed from the cache. So when the user tried to run the application a
new plan was being complied and thus they experineced either the
timeouts or slow loading times.
Figure 3
There
are no jobs running during that time of the day to cause the execution
plan to be removed e.g Index rebuilds, Alterations to Indexes or tables.
These types of operations only occur out of normal working hours, late
at night or very early in the morning. So this eliminated these as
potential causes. The other possible cause of flushing the cached plan
was memory pressures on the Sql Instance. So a Perfmon counter was setup
and run at 15 second interval over a 3 day period.
The analysis of perform counters turned up some interesting results. The first counter to review was the Page life expectancy.

Figure 4
It’s
shown in image 1 that spikes in User Connectivity correlate with Page
life expectancy (PLE) sharp drop although this is not the initial cause
of the PLE downward trends.
A
further look at the Batch requests along with PLE did identify some
relationship with the sharp drops in PLE. There were some spikes during
normal working hours (9am-5pm) in Batch requests that preceded PLE drops.
Figure 5
The
below screenshot shows the correlation between PLE, Batch Requests/sec
and SQL Compilations/sec. The scale has been increased for viewing
purposes. The Microsoft recommendation is for SQL Compilations to be 10%
below Batch Requests. For the majority of times its observed this was
the case. However not exclusively, as its been noticed the SQL
Compilations/Sec did exceed Batch Requests/Sec during normal work hours.

Figure 6
A
granular look at the counters shows at times SQL Compilations were
higher than Batch Requests as highlighted in figure 7. Below is a zoomed
in view of a 9AM to 10PM time slot.
Figure 7
It’s shown in figure 7 in three points SQL Compilations/Sec were higher than Batch Requests.
The
perform counter Average disk Sec/Read was also reviewed. Below it’s
shown a correlation between Disk Read activity and PLE downward trends.
Figure 8
In Figure 9 it’s showing the correlation with Average Disk Reads and Batch Requests activity.

Figure 9
From
these findings it decided that a further investigation is required on
using either a profile trace or Extended Events. A more granular
observation is needed to identify the queries running at these periods
of PLE downward trends.